Managing inventory across multiple warehouses can look manageable at first, but the real challenge appears when stock data begins affecting reporting quality. A growing WooCommerce store needs more than total stock visibility. It needs clear insight into where products move fastest, where shortages occur, and which locations perform best.
That is exactly why understanding how WooCommerce multi locations inventory management improves analytics becomes important. By organizing stock, sales, and inventory movement data by location instead of combining everything into one total, businesses gain clearer reports, more accurate KPIs, stronger regional forecasting, and better inventory planning. Continue reading to explore more on this.
What Goes Wrong Without Location Tracking?
Without location-level tracking, WooCommerce inventory analytics becomes distorted. Global stock totals hide warehouse-level imbalances, weaken KPI accuracy, and reduce forecasting reliability. Understanding what breaks without location tracking reveals why multi-location analytics is essential.
- Stockouts at one warehouse get masked by surplus elsewhere, so service-level problems don’t show up in reports.
- Overstock builds up in slow locations, inflating holding costs and distorting inventory valuation analytics.
- Global sales look healthy, but location-level demand signals stay hidden, weakening forecasting and allocation decisions.
- Transfers happen reactively, yet transfer volume, lead time, and imbalance trends remain unmeasured.
- KPI accuracy drops: turnover, sell-through, and stockout rate become misleading because they’re calculated without location context.
Global totals hide local realities, so analytics becomes descriptive, not decision-ready.
How WooCommerce Multi Locations Inventory Management Improves Analytics?
Multi-location inventory systems improve WooCommerce analytics by restructuring how stock data is stored, segmented, and queried. Instead of relying on aggregated totals, inventory becomes location-aware, enabling warehouse-level KPIs, demand forecasting, and operational performance analysis with significantly higher accuracy.
The transformation happens at the data layer.
When you implement WooCommerce multi locations inventory management, inventory stops being a single static number and becomes structured, segmented data tied to physical distribution points. That structural change is what unlocks deeper analytics.
Here’s how it improves analytics technically and strategically:
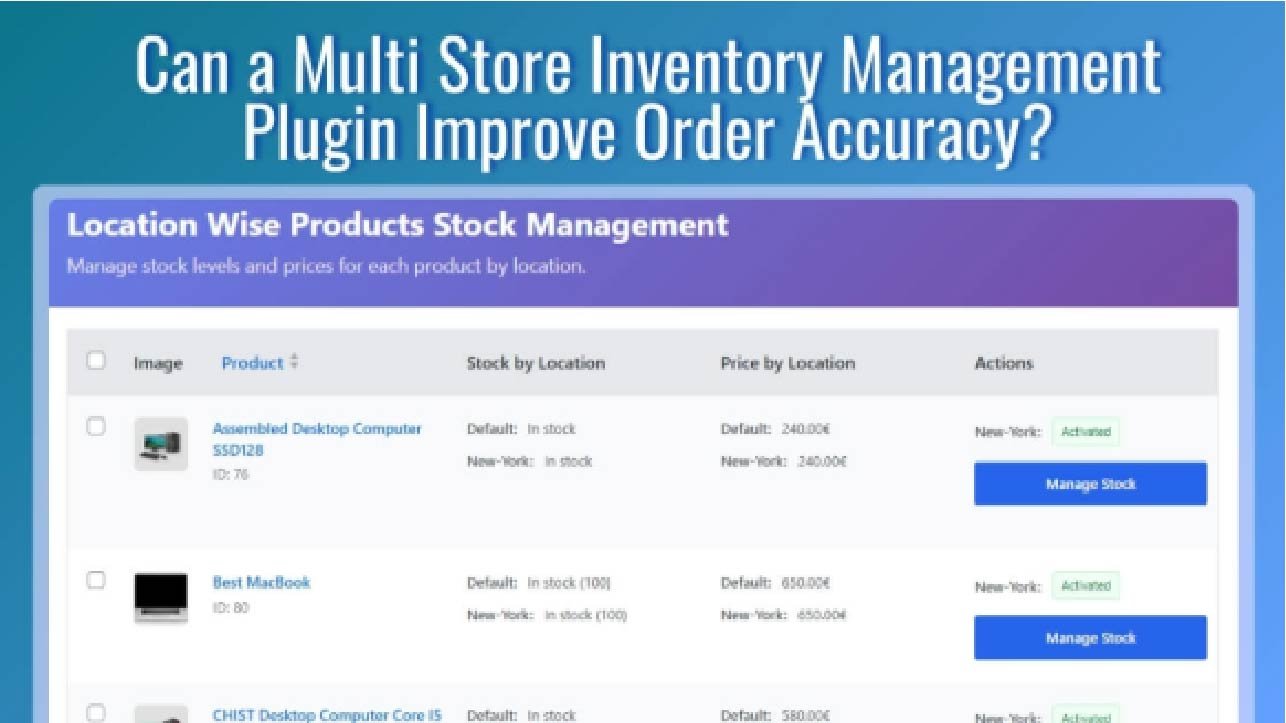
Data Segmentation by Location (Foundation of Accurate Reporting)
In a traditional setup:
Product A – Stock: 300
With multi-location tracking:
Product A – Warehouse A: 120
Product A – Warehouse B: 80
Product A – Store C: 100
Each stock value is stored and updated independently per location.
Why This Improves Analytics
- Enables per-location sales attribution
- Makes turnover calculations warehouse-specific
- Identifies stock imbalances instantly
- Prevents global stock numbers from masking local shortages
Without segmentation, KPIs such as stockout rate and sell-through ratio become mathematically distorted because they rely on aggregated data.
Data granularity directly improves analytical precision.
Order-to-Location Mapping (Turning Sales into Operational Intelligence)
Once stock is segmented, the next analytical layer comes from order attribution.
When an order is fulfilled from a specific warehouse:
- Stock reduces at that location only
- The fulfillment source is recorded
- Shipping time can be tied to that warehouse
Analytics Gains
You can now measure:
- Orders fulfilled per warehouse
- Fulfillment speed by location
- Cancellation and return rates per warehouse
- Logistics efficiency per region
Instead of viewing orders as global events, analytics becomes warehouse-aware. This supports operational benchmarking and service-level optimization.
Stock Movement & Transfer Intelligence (Beyond Sales Data)
Multi-location systems log:
- Transfers between warehouses
- Restocks per location
- Manual stock adjustments
- Low-stock threshold triggers
These events create movement-level datasets.
Analytical Impact
This enables:
- Transfer frequency analysis
- Replenishment lead-time tracking
- Detection of chronic stock imbalances
- Root-cause analysis of shortages
Traditional WooCommerce setups do not generate structured transfer analytics, which limits visibility into internal inventory flow.
Movement tracking transforms static inventory into a dynamic data stream.
Location-Based KPI Accuracy (Precision in Core Metrics)
When inventory is tracked per site, key business metrics become statistically reliable. Multi-location inventory improves the accuracy of:
- Stockout rate per location
- Inventory turnover per warehouse
- Sell-through rate per outlet
- Dead stock percentage per site
- Reorder point effectiveness
- Location-based gross margin
Because these KPIs are calculated using segmented datasets, they reflect operational reality rather than blended averages.
Higher resolution data produces higher confidence decisions.
Regional Demand Forecasting (Predictive, Not Reactive)
Historical sales stored per location reveal regional consumption patterns.
For example:
- Product X sells 3x faster in Region A than in Region B
- Seasonal spikes differ across warehouses
- One outlet consistently experiences faster sell-through
Forecasting Improvements
With location-based datasets, businesses can:
- Set reorder points per warehouse
- Allocate stock strategically
- Reduce overstock in slow regions
- Anticipate demand spikes regionally
Forecasting becomes evidence-based rather than assumption-driven.
Technical Insight: Why This Improves Reporting Structurally
At a technical level, multi-location systems:
- Associate stock quantities with location identifiers
- Update stock through order and transfer hooks
- Store movement logs per warehouse
- Allow report queries filtered by location ID
Because analytics queries can filter by location instead of product only, reports gain dimensional depth.
Analytics shifts from:
“How is this product performing?”
to:
“How is this product performing in each operational node?”
That dimensional shift is what truly improves analytics.
WooCommerce multi-location inventory management improves analytics by converting global stock data into segmented, location-aware datasets. This enables accurate warehouse-level KPIs, fulfillment analysis, transfer tracking, and regional demand forecasting that single-location inventory systems cannot provide.
Technical Data Flow: How Multi-Location Analytics Is Generated
Multi-location analytics in WooCommerce is generated through a five-step data flow: order attribution to a specific location, location-level stock updates, structured event logging, filtered reporting queries, and dashboard visualization. This architecture enables warehouse-level KPIs and operational intelligence.
Below is the structured data pipeline that powers location-based analytics.
Step 1: Order Placement (Location Attribution Layer)
When a customer places an order, the system assigns the order to a specific warehouse or store based on stock availability, routing rules, or manual selection.
At this stage:
- The fulfillment location is identified
- The order is tagged with a location reference
- Sales data becomes location-aware
Analytics Impact
This enables:
- Sales reporting per warehouse
- Order volume tracking by region
- Location-based revenue attribution
Without this attribution layer, analytics remain globally aggregated.
Step 2: Stock Update (Granular Inventory Adjustment)
Once the order is processed, inventory is reduced only at the assigned location — not globally.
The database updates:
- Product ID
- Location ID
- Updated stock quantity
- Timestamp of change
Why This Matters
Location-level stock updates allow:
- Accurate turnover calculation per warehouse
- Real-time stock visibility
- Reliable stockout rate measurement
Granular updates prevent analytical distortion caused by blended stock values.
Step 3: Event Logging (Movement Intelligence Layer)
Beyond order-based reductions, multi-location systems log structured events such as:
- Transfers between warehouses
- Manual stock adjustments
- Restocks per location
- Low-stock threshold triggers
Each event includes:
- Location identifier
- Movement type
- Quantity changed
- Date and time
Analytics Advantage
This enables:
- Transfer frequency analysis
- Replenishment lead-time tracking
- Detection of recurring shortages
- Inventory imbalance diagnostics
Event logging converts operational actions into reportable datasets.
Step 4: Report Query Generation (Data Filtering & Segmentation)
With segmented stock and event logs in place, analytics queries can filter data by:
- Location ID
- Product ID
- Date range
- Movement type
- Order status
Instead of pulling a single global stock number, reports can isolate specific warehouse performance.
Analytical Power
This supports:
- Warehouse comparison reporting
- Region-specific demand analysis
- KPI breakdown by operational node
- Performance benchmarking
Filtered query capability is what gives multi-location analytics dimensional depth.
Step 5: Dashboard Visualization (Insight Layer)
The processed data is then rendered into:
- Trend graphs
- Inventory turnover charts
- Stockout rate reports
- Low-stock alerts per location
- Exportable CSV summaries
- Business intelligence integrations
Visualization transforms structured data into decision-ready insights.
Multi-location analytics improves WooCommerce reporting by adding warehouse-level data segmentation, structured movement logs, and location-filtered queries. This enables accurate KPIs, regional forecasting, and operational benchmarking that global stock tracking cannot provide.
Key Inventory KPIs That Become Truly Actionable
Location based inventory tracking transforms raw stock data into measurable performance indicators. When KPIs are calculated per warehouse instead of globally, decisions become precise, and risk exposure decreases. Let’s examine the most impactful metrics next.
- Stockout Rate per Location: Measures how often a specific warehouse runs out of stock, helping identify fulfillment risk zones and prevent revenue loss caused by regional availability gaps.
- Inventory Turnover Ratio per Warehouse: Calculates how quickly each location sells and replenishes stock, revealing operational efficiency differences and highlighting which warehouses move products faster than others.
- Sell Through Rate per Outlet: Compares units sold against available inventory at each store, uncovering real demand strength and supporting smarter allocation across regions.
- Dead Stock Percentage per Site: Identifies slow-moving inventory trapped in specific warehouses, helping reduce holding costs and improve capital utilization through redistribution strategies.
- Reorder Point Accuracy per Location: Evaluates whether restocking thresholds align with actual regional demand patterns, preventing premature purchasing or delayed replenishment decisions.
- Fulfillment Efficiency Index by Warehouse: Tracks processing speed and order handling performance per location, supporting service level optimization and better customer satisfaction metrics.
These location specific KPIs transform analytics from descriptive reporting into strategic decision-making tools, ensuring inventory performance aligns with operational goals and sustainable growth.
Multi-Location vs Traditional Inventory Reporting
Choosing between traditional inventory tracking and multi-location inventory management directly impacts reporting accuracy, KPI reliability, and forecasting strength. The difference is not cosmetic. It is structural. Below is a clear comparison that explains why analytics improves significantly with location-aware systems.
Multi-location inventory reporting improves analytics by segmenting stock, sales, and movement data per warehouse instead of aggregating everything globally. This enables granular KPIs, regional forecasting, transfer intelligence, and operational benchmarking.
Capability Comparison
| Capability | Traditional Inventory | Multi-Location Inventory |
| Stock View | Global only | Per location with warehouse-level visibility |
| Sales Insight | Store-wide totals | Location-filtered revenue and order attribution |
| Demand Forecasting | Limited and generalized | Region-based and pattern-driven |
| Transfer Tracking | Manual adjustments with no structured logs | Automated, logged, and reportable movements |
| KPI Accuracy | Surface-level blended averages | Granular and operationally precise |
Why This Structural Difference Improves Analytics
- Stock Visibility Becomes Dimensional: Traditional reporting treats inventory as a single number per product. Multi-location systems attach stock quantities to specific warehouse identifiers, enabling deeper analysis.
- Sales Attribution Gains Context: Instead of total sales data, analytics can isolate which warehouse fulfilled orders, supporting performance benchmarking and regional profitability analysis.
- Forecasting Moves From General to Regional: Global data averages demand signals. Location-based data reveals real consumption patterns, seasonal spikes, and demand variability by region.
- Transfer Intelligence Becomes Measurable: Manual inventory adjustments do not generate structured analytical datasets. Automated transfer logs provide measurable movement history for optimization.
- KPI Reliability Increases: Metrics like turnover ratio, stockout rate, and sell-through percentage become statistically accurate when calculated per warehouse rather than across blended totals.
Analytical Impact
With traditional inventory tracking, reporting is descriptive. With multi-location inventory management, reporting becomes diagnostic and predictive.
The Hidden Analytics Problem in Multi-Location WooCommerce Stores
WooCommerce tracks inventory globally per product by default, without separating stock by warehouse or store location. As a result, analytics lacks location context, making it difficult to measure regional demand, fulfillment efficiency, and warehouse performance accurately.
The Way WooCommerce Handles Inventory by Default
In its standard configuration, WooCommerce maintains inventory as a single stock value assigned to each product. This means the system records only the total quantity available, without identifying where that stock is physically stored.
As a result:
- One stock value per product is shared across the entire store
- No native warehouse-level breakdown exists for stock allocation
- No built-in location-specific turnover reports are generated
- Order fulfillment data cannot be linked to specific locations
While this approach works for small stores with a single storage location, it becomes problematic as businesses scale.
Why This Becomes a Serious Analytics Issue
For businesses operating with more complex logistics structures, such as:
- Multiple warehouses managing different inventory pools
- Hybrid retail and online sales operations
- Regional distribution centers serving different markets
- Franchise outlets sharing a centralized product catalog
Global inventory reporting quickly becomes misleading.
Without location-based segmentation:
- A warehouse experiencing stockouts may be hidden by surplus inventory elsewhere.
- Sales trends from high-performing regions cannot be isolated.
- Overstock in slow locations remains undetected in aggregated reports.
- Forecasting models rely on blended averages rather than regional demand signals.
These limitations distort key metrics such as inventory turnover, sell-through rate, and stock availability accuracy.
The Reasons Location Context Matters for Analytics
Accurate analytics requires understanding not only how much stock exists but also where that stock is located and how it moves across the distribution network. Location-aware data enables businesses to:
- Measure warehouse performance independently
- Track demand differences between regions
- Optimize inventory allocation strategies
- Improve replenishment planning and forecasting accuracy
Without this context, inventory reports remain surface-level, and decision-making becomes reactive rather than data-driven.
In short, the hidden analytics problem in multi-location WooCommerce stores is not the lack of data, but the lack of a location-level data structure that turns raw inventory numbers into meaningful operational insights.
Business Scenarios Where Analytics Improves Most
Location based inventory analytics becomes most valuable when businesses operate across multiple operational nodes. Understanding where demand originates improves planning accuracy and operational efficiency. Explore the scenarios below to see where impact grows.
- Multi Warehouse eCommerce Brands: Businesses operating several warehouses can compare stock movement, sales velocity, and fulfillment efficiency across locations, allowing smarter inventory allocation and improved logistics planning.
- Retail and Online Hybrid Stores: Stores combining physical outlets with online sales can analyze which locations drive in-store purchases and which support online fulfillment demand.
- Regional Distribution Networks: Companies serving different geographic regions can analyze demand patterns, seasonal trends, and restocking needs by location to optimize regional inventory distribution strategies.
- Franchise Business Models: Franchise operations benefit from standardized inventory metrics that allow headquarters to compare outlet performance, monitor stock health, and maintain consistent supply across locations.
These scenarios demonstrate how location-specific analytics converts inventory data into strategic insights, helping businesses improve forecasting accuracy, optimize fulfillment operations, and strengthen data-driven decision-making.
Frequently Asked Questions
Understanding multi-location inventory analytics often raises additional practical questions for WooCommerce store owners. The answers below address common concerns related to reporting, system behavior, and operational visibility that many users search for when exploring advanced inventory management.
Can Woocommerce Generate Location-Based Inventory Reports By Default?
No. Standard WooCommerce tracks stock globally at the product level. Location-based reports typically require an extended inventory system that supports warehouse-level stock segmentation.
Does Multi-Location Inventory Affect WooCommerce Performance?
When implemented properly, it does not significantly affect performance. Most systems optimize database queries and caching so that location-level inventory tracking remains efficient even with larger product catalogs.
Can Location-Based Inventory Data Be Exported For Business Intelligence Tools?
Yes. Many multi-location inventory systems allow exporting reports as CSV or Excel files, enabling integration with external analytics platforms and business intelligence dashboards.
How Does Location Tracking Improve Stock Allocation Decisions?
By showing inventory levels and demand trends per warehouse, businesses can redistribute stock strategically and prevent regional shortages or overstock situations.
Is Multi-Location Inventory Useful For Small WooCommerce Stores?
It can be beneficial if the store operates multiple storage points or fulfillment centers. Even small businesses gain clearer demand insights and better stock planning with location-based analytics.
Can Multi-Location Inventory Help Identify Slow-Moving Products?
Yes. Tracking sales velocity and stock levels per location helps identify dead stock or slow-moving inventory in specific warehouses, enabling targeted clearance strategies.
Conclusion
Managing inventory across multiple warehouses requires more than simple stock counts. Understanding how WooCommerce multi locations inventory management improves analytics helps businesses gain deeper insights into sales patterns, stock movement, and fulfillment performance.
By organizing inventory data by location, store owners can improve forecasting, monitor warehouse performance, and make smarter operational decisions. Location-based analytics turns inventory tracking into a strategic advantage for sustainable WooCommerce growth.


Discussion about this post